Key Findings

Using scientifically developed best management practices, unpiloted aerial systems (UAS) can serve as a lower-cost, effective tool for supplementing field-based methods to characterize the forest.
UAS imagery can be used to measure individual tree health, as well as the growth of invasive species, increasing acurracy by 14.9 percent compared to traditional satellite imagery.
Combining UAS-captured forest imagery and digital photogrammetry can create more informative three-dimensional maps of forest composition.
About the Co-Author
Russell Congalton, Professor of Natural Resources and the Environment
Contact information: Russ.Congalton@unh.edu, UNH Basic and Applied Spatial Analysis Lab (BASAL)
This research was published in the INSPIRED: A Publication of the New Hampshire Agricultural Experiment Station (Winter 2023)
Researchers: B.T. Fraser and R. Congalton
New Hampshire has the second-highest proportion of land in forest in the U.S. (behind only Maine), with approximately 80 percent (4.68 million acres) in forest cover, according to the U.S. Forest Service. Cost-effective ways to assess the health and composition of the state’s significant forestland are necessary for supporting long-term management and economic needs. However, traditional forest inventorying methods are resource intensive and may not support a full understanding of dynamic disturbances, such as climate change or invasive forest pests, pathogens and plants. This research considers whether new technologies such as unpiloted aerial systems (UAS) can help overcome the limitations of traditional assessment methods and provide more informative characterizations of northeastern forests.
Traditional forest mapping
Local scale forest management necessitates both timely and accurate information. Data describing the species composition, forest structure and tree health are critical for meeting future natural resource demands. The conventional practice for acquiring forest data—continuously measuring forest inventory plots—may not capture the detailed characteristics necessary to support accurate and complete management decisions. Emerging technologies, such as UAS, have the potential to enhance traditional forest inventories by providing more informed assessments of rare community characteristics, dynamic disturbances or between-plot variability.
Remotely sensed data—including aerial and satellite imagery—have been a standard feature in forest management for over 50 years. However, they have often been limited to serving as a basic source of a birds-eye (synoptic) perspective due to their limited collection intervals or insufficient spatial resolution. UAS technology is leading to major innovations in remote sensing data availability and capability.
Using UAS in forest mapping
For an investment as little as $1,000, a highly capable UAS can be purchased and deployed to capture data at scales finer than the individual tree or plant. The research conducted in the UNH Basic and Applied Spatial Analysis Lab has focused on combining the capabilities of rapidly developing hardware with conventional practices in remote sensing to maximize their effectiveness. Research has been conducted to use digital imagery collected from UAS to analyze forest composition, structure, health and the growth of invasive species communities.
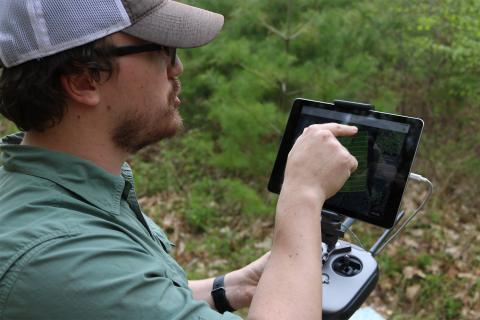
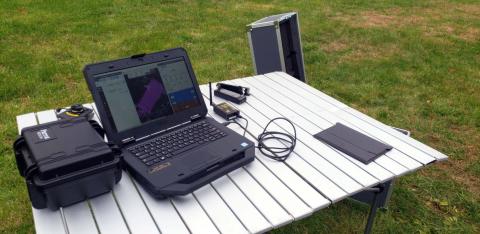
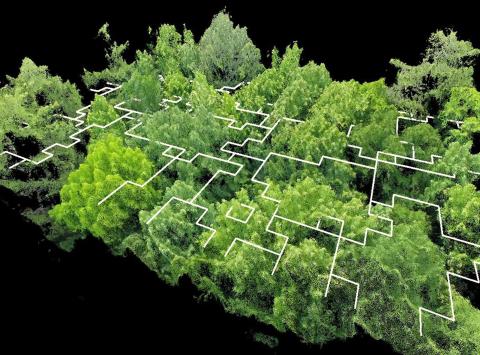
Each UAS flight begins with a site assessment and flight plan. Each mission is carried out via an automated mission planner (Figs. 1 and 2) to ensure the safety of the aircraft and the precision of the collected imagery. Depending on the information required, images are collected using either natural color or near infrared (NIR) sensors.
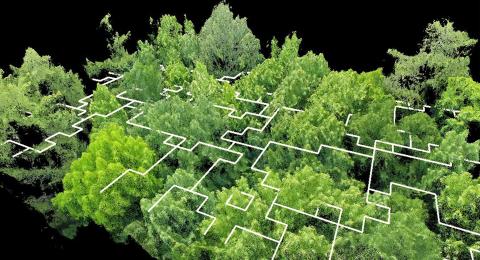
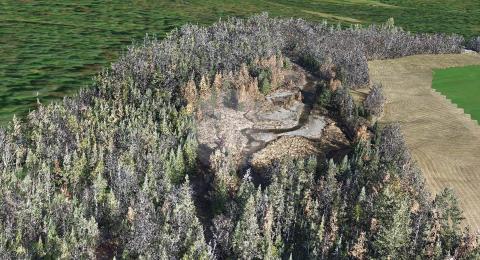
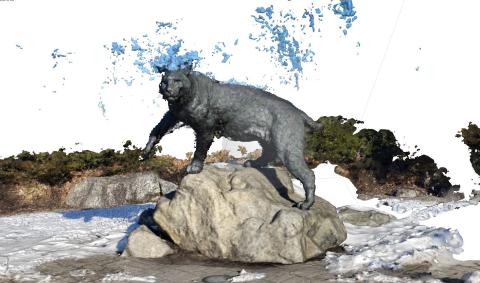
Including NIR light (Fig. 3) enables measuring individual tree health because healthy vegetation reflects high amounts of NIR light while unhealthy vegetation reflects much less. After collection, the imagery is processed using a combination of computer vision and digital image processing software to generate both 2D and 3D models. This workflow is often called digital photogrammetry, or Structure-from-Motion (SfM), and is highly effective at feature reconstruction using unordered imagery (Fig. 4).
Pairing UAS and 3D reconstruction
The pairing of UAS and SfM is ideal because of the ability to capture and identify features across large image collections. In most instances, between 2,000 and 15,000 images are collected when mapping a single study area. The spatial data products from the SfM process can include ultra-high-resolution image composites (Fig. 3) or point clouds consisting of billions of points (Figs. 4 and 5). The combination of geometric and spectral data supports a wide variety of measurements and observations.
Combining these spatial data with a machine-learning classification algorithm resulted in a higher overall accuracy for mapping species composition of between 4 percent and 16 percent when compared with results from traditional airborne imagery. During the assessment of forest structure, the UAS data generated a highly efficient estimate of individual tree diameter at breast height, stand basal area, tree density and stand density.
Using a combination of sensors, analysis of the UAS data produced a 14.9 percent higher overall accuracy than satellite imagery in detecting individual tree health. This assessment of tree health has since encouraged an investigation of more advanced sensors for detecting American beech (Fagus grandifolia) bark disease. More broadly, these assessments have led to developing an aspirational holistic approach for forest monitoring with other recent and ongoing research focusing on outlining best management practices in UAS flight planning and data processing for practitioners in the state and region.
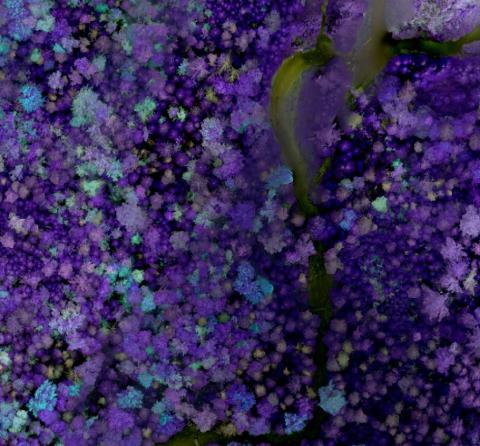
Fig. 3: A near-infrared (NIR) or ‘False Color Composite’ created using UAS imagery. This figure represents a small portion of a wider mapping area that contained approximately 10,000 images. The NIR imagery provides important characteristics for differentiating tree species and tree health.
Related published research
- Forests: A Comparison of Methods for Determining Forest Composition from High-Spatial-Resolution Remotely Sensed Imagery
- Geographies: Analysis of Unmanned Aerial System (UAS) Sensor Data for Natural Resource Applications: A Review
- Remote Sensing: Estimating Primary Forest Attributes and Rare Community Characteristics Using Unmanned Aerial Systems (UAS: An Enrichment of Conventional Forest Inventories
- Remote Sensing: Issues in Unmanned Aerial Systems (UAS) Data Collection of Complex Forest Environments
- Remote Sensing: Monitoring Fine-Scale Forest Health Using Unmanned Aerial Systems (UAS) Multispectral Models
Combining these spatial data with a machine-learning classification algorithm resulted in a higher overall accuracy for mapping species composition of between 4 percent and 16 percent when compared with results from traditional airborne imagery. During the assessment of forest structure, the UAS data generated a highly efficient estimate of individual tree diameter at breast height, stand basal area, tree density and stand density.
Using a combination of sensors, analysis of the UAS data produced a 14.9 percent higher overall accuracy than satellite imagery in detecting individual tree health. This assessment of tree health has since encouraged an investigation of more advanced sensors for detecting American beech (Fagus grandifolia) bark disease. More broadly, these assessments have led to developing an aspirational holistic approach for forest monitoring with other recent and ongoing research focusing on outlining best management practices in UAS flight planning and data processing for practitioners in the state and region.
This material is based on work supported by the NH Agricultural Experiment Station through joint funding from the USDA National Institute of Food and Agriculture (under Hatch award number 1026105) and the state of New Hampshire. Authored by B.T. Fraser and R.G. Congalton.
