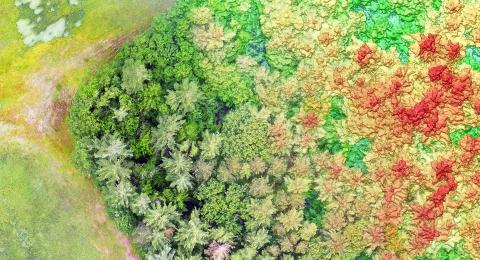
Key Findings

Unpiloted aerial system (UAS) technology effectively measures forested land edges frequently and consistently and at capturing greater land areas.
When comparing UAS data with imagery data collected at ground level, information from UAS accurately characterized tree canopy cover at forest edges.
UAS imagery and ground data detected edge effects and show a pattern of forest cover decreasing within 45-50 meters of the edge, followed by an increase.
About the Co-Author

Russell Congalton, Professor of Natural Resources and the Environment
Contact information: Russ.Congalton@unh.edu, UNH Basic and Applied Spatial Analysis Lab (BASAL)
This research was published in the INSPIRED: A Publication of the New Hampshire Agricultural Experiment Station (Winter 2023)
Researchers: H. Grybas and R. Congalton
An outcome of continued urban growth in New England is the fragmentation of landscapes, which has led to increasing challenges in sustaining local biodiversity and ecosystem services. From 1983–2007, forested land was cleared in New Hampshire at an average annual rate of 3,000 acres, according to the U.S. Forest Service. Development across the Granite State has created challenges and questions around biodiversity and ecosystem changes at forest edges. This research used rapidly emerging unpiloted aerial system (UAS) technologies to estimate foliage cover and then characterize and measure changes in forest structure near forested edges. Improved methods for collecting and using UAS data are important for cost-effective, adaptable land management practices.
Measuring edge influences
When forest areas are removed, what remains is exposed to edge influences, which affect abiotic and biotic processes at the forests’ edge. This can lead to significant ecological changes— more light availability, temperature variability and wind—as well as changes in forest structure (Fig. 1). As a result, plants and animals that once existed in a large patch of forest may not thrive or survive in smaller patches with new edges, while invasive species can enter.
Characterizing and measuring the extent of change at forest edges is important for making land management decisions, especially in the face of climate change. However, making these assessments can be difficult due to the large number of factors that can affect conditions at forest edges. Previously, edge analysis of forested land was conducted using transects measured in the field. This study assessed the potential of imagery acquired from UAS to accomplish the same goal.
Using UAS in forest edge measurements
Imagery collected using UAS has the potential to detect and measure the forest’s response at the edge quickly and repeatedly, thus allowing a larger amount of area to be covered with less work. This study was an initial test of using UAS imagery to detect changes in foliage cover—a component of forest structure known to exhibit changes caused by edge influences—across forest edges in New England.
The study was conducted on Blue Hills Foundation conservation lands of nearly 7,500 acres in southeastern New Hampshire. The area represents a natural, highly mixed, transition hardwood-hemlock-white pine forest community.
UAS imagery was obtained of the study area on July 1, 2020, using an AgEagle (formerly senseFly) eBee X fixed-wing aircraft with an Aeria X digital single-lens reflex camera capturing high spatial resolution (24 megapixel) imagery in natural color (RGB). The imagery was collected 100 meters above the tree canopy, with 1,299 images collected in all.
The imagery was processed using the Agisoft Metashape professional software to produce a 3D point cloud and an orthorectified mosaic. Changes in canopy cover with increasing distance from the forest edge were measured on the ground using digital cover photography and from imagery-based maps of canopy gaps produced from UAS data (Fig. 2).
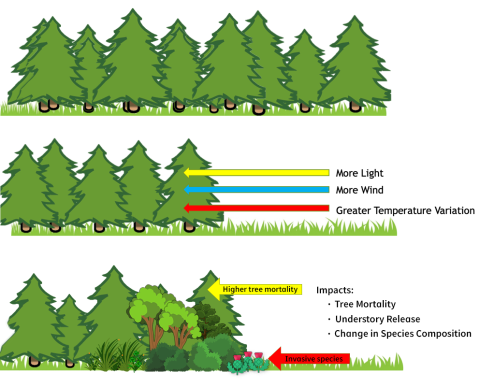
Fig. 1: Progression that occurs when an edge is created where forest area is removed. Initially, there is more light and wind and a greater variation in temperature. These added variables can result in tree mortality, under-story release and changes in species composition, including the addition of invasive plants.
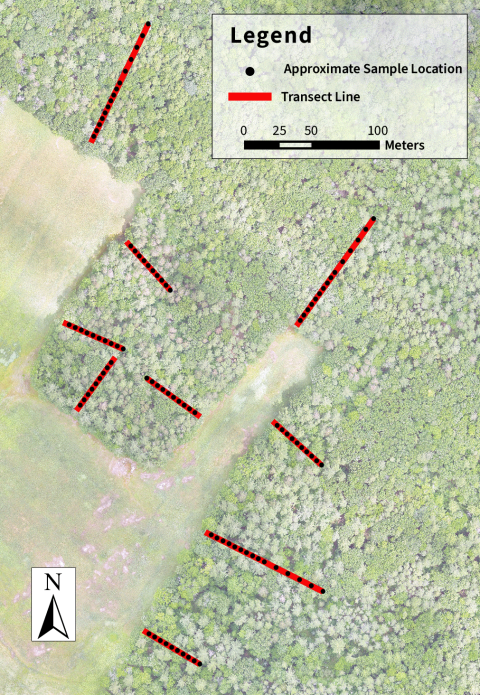
Fig. 2: The estimated location of transects (red lines) and sample points (black dots) along each transect as measured on the ground. Locations for transects were based on GPS position beginning at the edge and following an azimuth bearing of the transect. Sample locations were systematically placed along the transect line, starting at 5 meters and extending to either 50 or 100 meters.
The imagery-based canopy gap products were significantly similar to ground estimates for canopy cover (p-value > 0.05) than the photogrammetric point clouds, but still suffered overestimation (root-mean-square error of 0.088) due to the inability to detect small canopy openings (Fig. 3). Both the ground and UAS data were able to detect a decrease in canopy cover from between 45–50 meters from the edge, followed by an increase to 100 m.
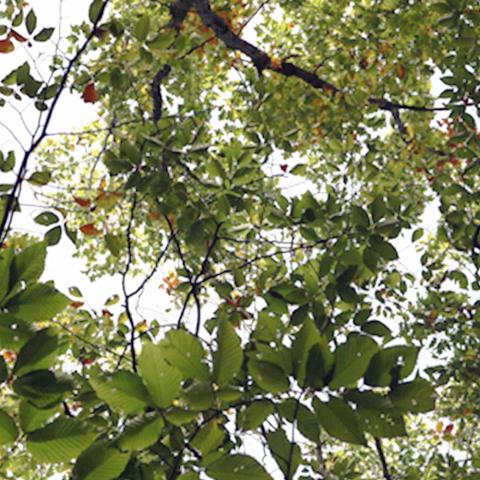
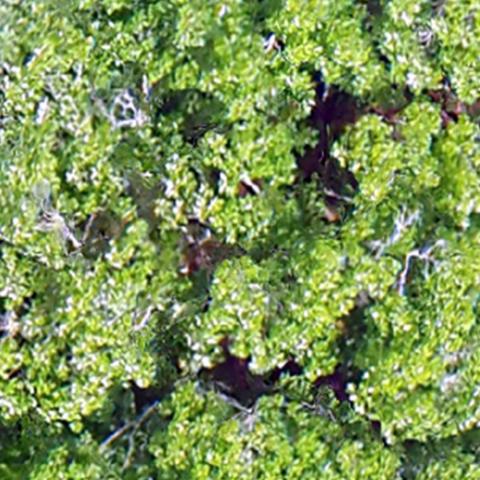
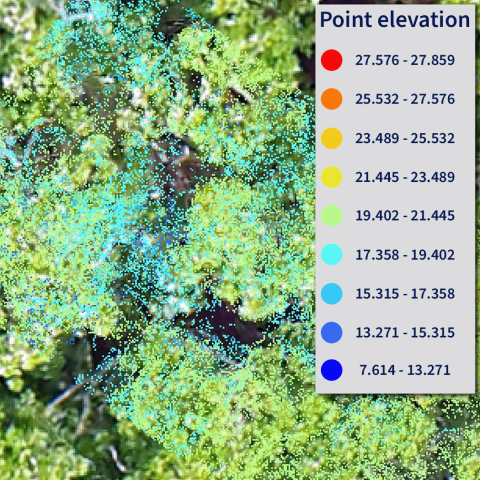
Fig. 3: A comparison between the digital cover photos taken from the ground looking up (top image) and the 2.5 cm orthomosaic (center) and the photogrammetric point cloud (bottom) taken of a sample location.
The UAS data offered the advantage of a greater sampling intensity, allowing researchers to better detect a significant edge effect of minimal magnitude in the presence of heavy variability.
Related published research
- Remote Sensing: A Comparison of Multi-Temporal RGB and Multispectral UAS Imagery for Tree Species Classification in Heterogeneous New Hampshire Forests
- Forests: Evaluating the Capability of Unmanned Aerial System (UAS) Imagery to Detect and Measure the Effects of Edge Influence on Forest Canopy Cover in New England
- Forests: Evaluating the Impacts of Flying Height and Forward Overlap on Tree Height Estimates Using Unmanned Aerial Systems
- USDA Forest Service, Northeastern Research Station RB-NRS-95 Forests of Vermont and New Hampshire (2012) & NH Division of Forests and Lands: New Hampshire Forest Statistics
This material is based on work supported by the NH Agricultural Experiment Station through joint funding from the USDA National Institute of Food and Agriculture (under Hatch award number 1026105) and the state of New Hampshire. Authored by H. Grybas and R.G. Congalton.
This material is based on work supported by the NH Agricultural Experiment Station through joint funding from the USDA National Institute of Food and Agriculture (under Hatch award number 1026105) and the state of New Hampshire. Authored by H. Grybas and R.G. Congalton.
